Log return
r = ln(Pₜ / Pₜ₋₁)
BOTEvery calculation runs on log returns. They add across time, simple returns don't.
KILLSMixing simple and log returns when compounding P&L.
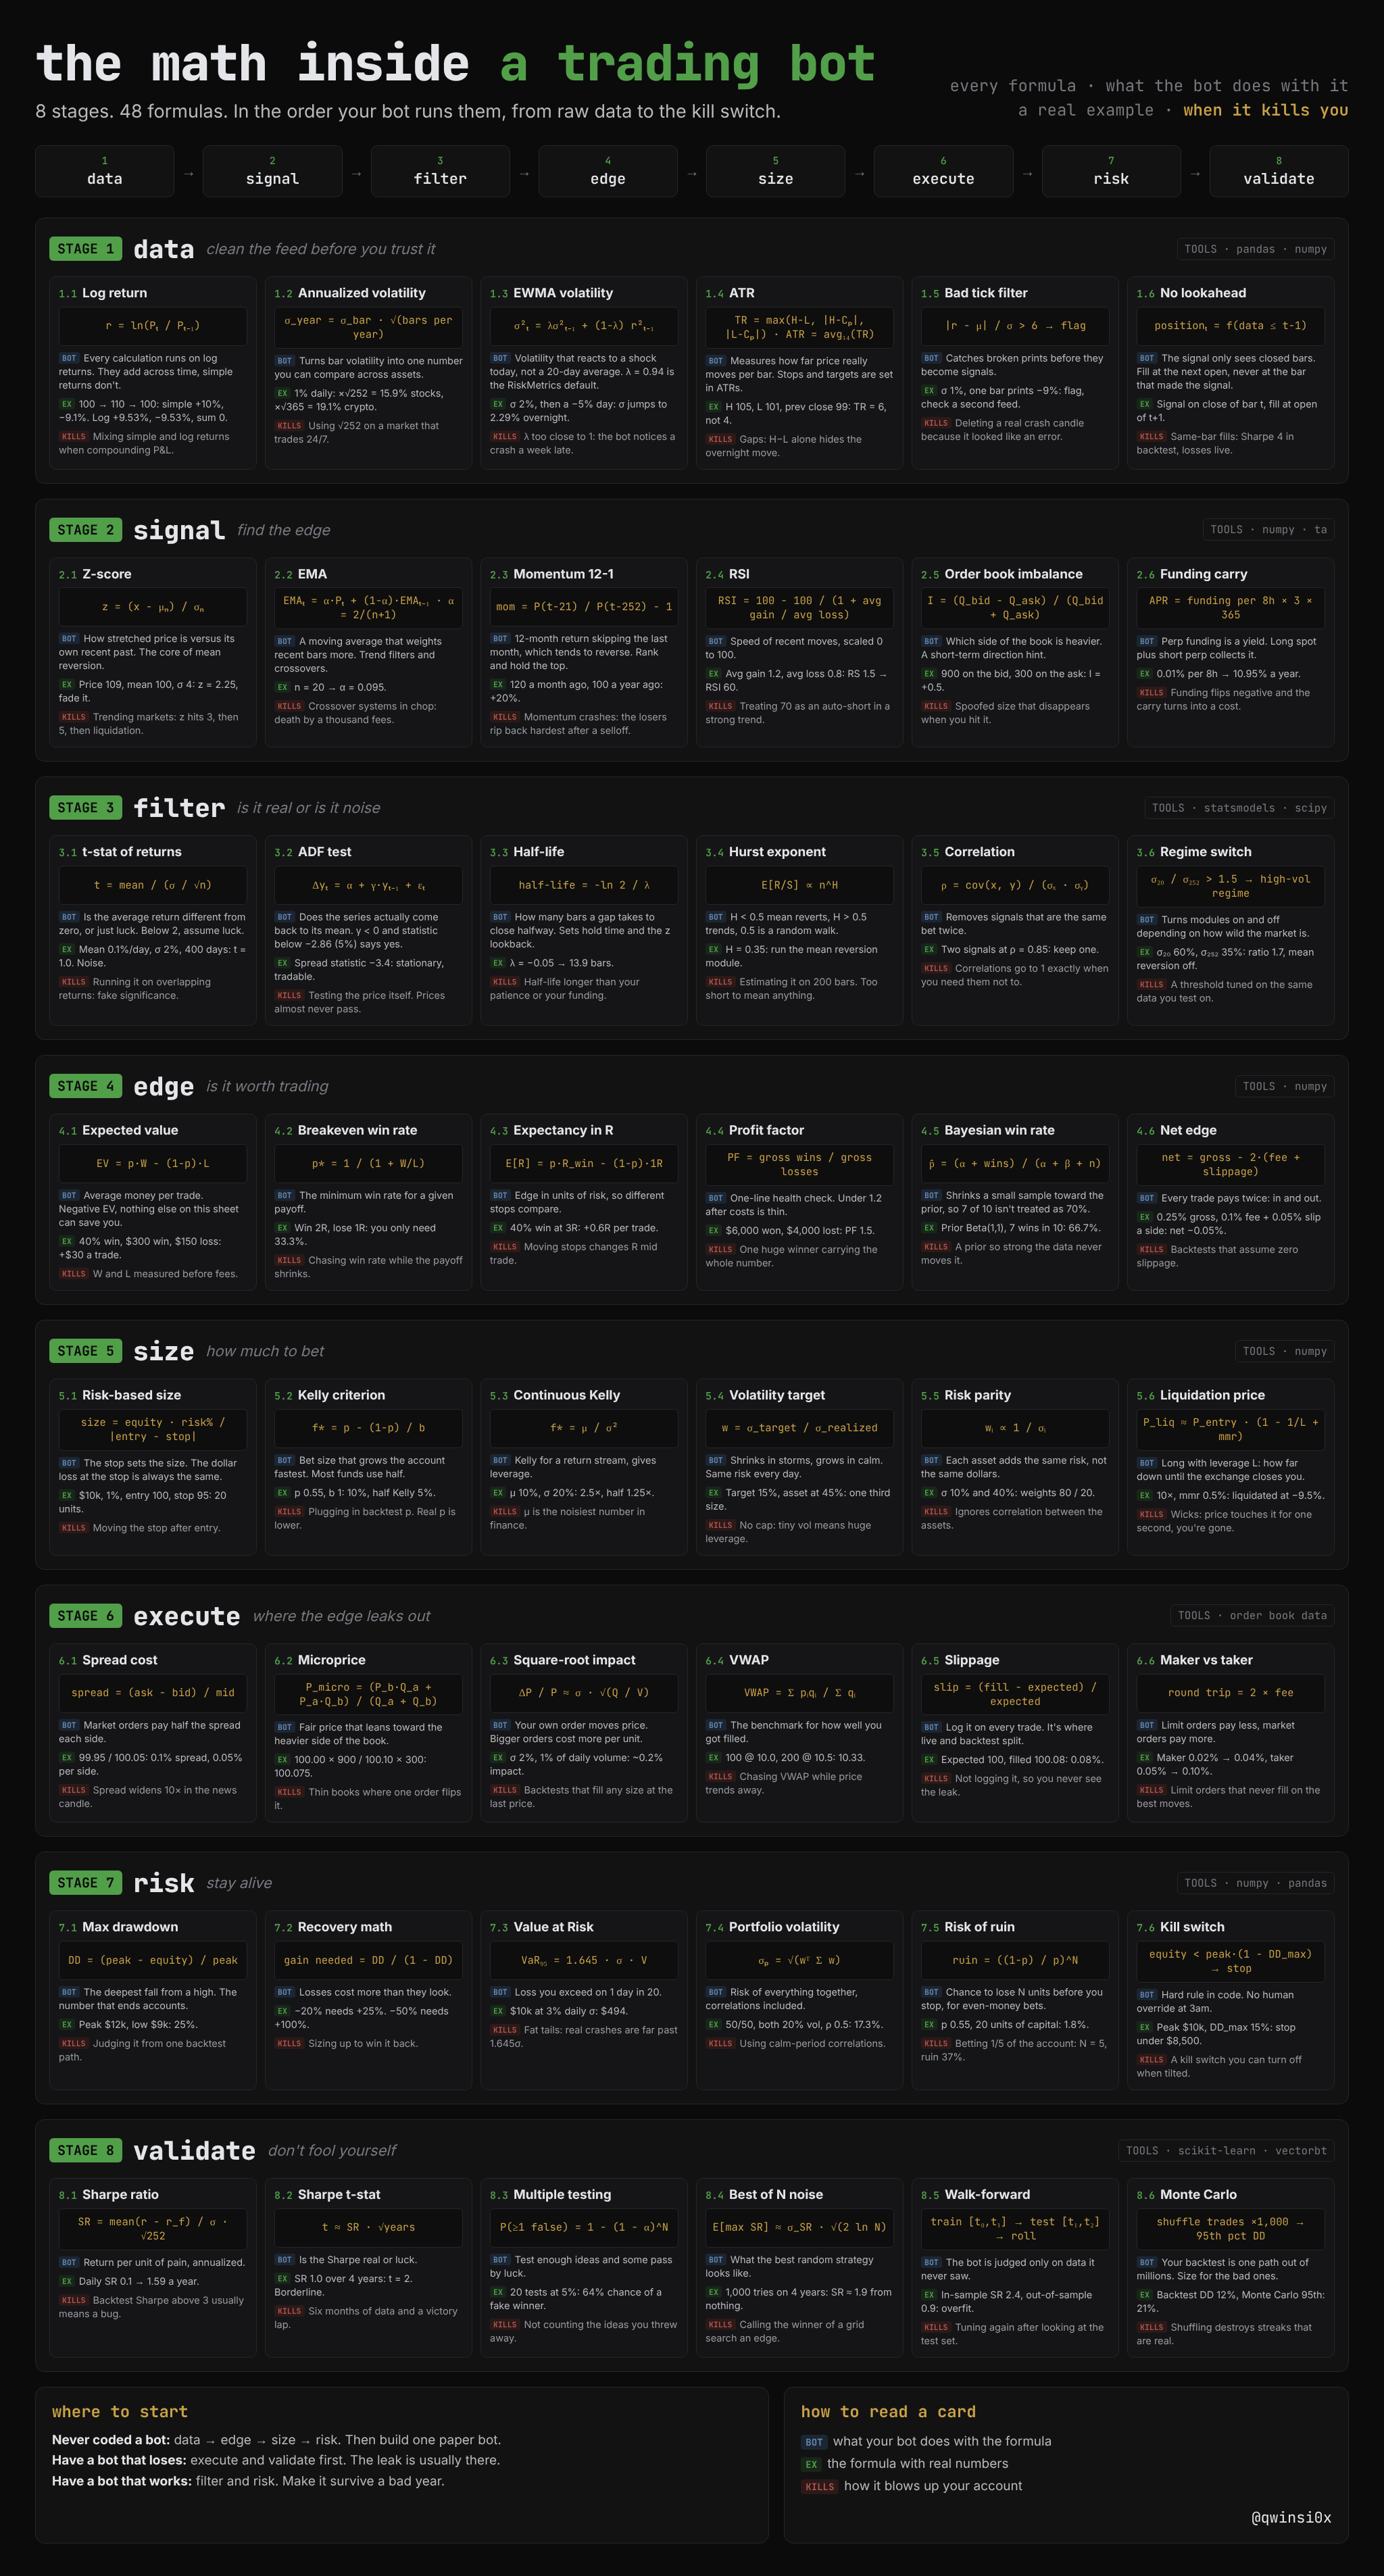
8 stages. 48 formulas. In the order your bot runs them, from raw data to the kill switch. Change any number on any card and watch what it does to your account.
BOTEvery calculation runs on log returns. They add across time, simple returns don't.
KILLSMixing simple and log returns when compounding P&L.
BOTTurns bar volatility into one number you can compare across assets.
KILLSUsing √252 on a market that trades 24/7.
BOTVolatility that reacts to a shock today, not a 20-day average. λ = 0.94 is the RiskMetrics default.
KILLSλ too close to 1: the bot notices a crash a week late.
BOTMeasures how far price really moves per bar. Stops and targets are set in ATRs.
KILLSGaps: H−L alone hides the overnight move.
BOTCatches broken prints before they become signals.
KILLSDeleting a real crash candle because it looked like an error.
BOTThe signal only sees closed bars. Fill at the next open, never at the bar that made the signal.
KILLSSame-bar fills: Sharpe 4 in backtest, losses live.
BOTHow stretched price is versus its own recent past. The core of mean reversion.
KILLSTrending markets: z hits 3, then 5, then liquidation.
BOTA moving average that weights recent bars more. Trend filters and crossovers.
KILLSCrossover systems in chop: death by a thousand fees.
BOT12-month return skipping the last month, which tends to reverse. Rank and hold the top.
KILLSMomentum crashes: the losers rip back hardest after a selloff.
BOTSpeed of recent moves, scaled 0 to 100.
KILLSTreating 70 as an auto-short in a strong trend.
BOTWhich side of the book is heavier. A short-term direction hint.
KILLSSpoofed size that disappears when you hit it.
BOTPerp funding is a yield. Long spot plus short perp collects it.
KILLSFunding flips negative and the carry turns into a cost.
BOTIs the average return different from zero, or just luck. Below 2, assume luck.
KILLSRunning it on overlapping returns: fake significance.
BOTDoes the series actually come back to its mean. γ < 0 and statistic below −2.86 (5%) says yes.
KILLSTesting the price itself. Prices almost never pass.
BOTHow many bars a gap takes to close halfway. Sets hold time and the z lookback.
KILLSHalf-life longer than your patience or your funding.
BOTH < 0.5 mean reverts, H > 0.5 trends, 0.5 is a random walk.
KILLSEstimating it on 200 bars. Too short to mean anything.
BOTRemoves signals that are the same bet twice.
KILLSCorrelations go to 1 exactly when you need them not to.
BOTTurns modules on and off depending on how wild the market is.
KILLSA threshold tuned on the same data you test on.
BOTAverage money per trade. Negative EV, nothing else on this sheet can save you.
KILLSW and L measured before fees.
BOTThe minimum win rate for a given payoff.
KILLSChasing win rate while the payoff shrinks.
BOTEdge in units of risk, so different stops compare.
KILLSMoving stops changes R mid trade.
BOTOne-line health check. Under 1.2 after costs is thin.
KILLSOne huge winner carrying the whole number.
BOTShrinks a small sample toward the prior, so 7 of 10 isn't treated as 70%.
KILLSA prior so strong the data never moves it.
BOTEvery trade pays twice: in and out.
KILLSBacktests that assume zero slippage.
BOTThe stop sets the size. The dollar loss at the stop is always the same.
KILLSMoving the stop after entry.
BOTBet size that grows the account fastest. Most funds use half.
KILLSPlugging in backtest p. Real p is lower.
BOTKelly for a return stream, gives leverage.
KILLSμ is the noisiest number in finance.
BOTShrinks in storms, grows in calm. Same risk every day.
KILLSNo cap: tiny vol means huge leverage.
BOTEach asset adds the same risk, not the same dollars.
KILLSIgnores correlation between the assets.
BOTLong with leverage L: how far down until the exchange closes you.
KILLSWicks: price touches it for one second, you're gone.
BOTMarket orders pay half the spread each side.
KILLSSpread widens 10× in the news candle.
BOTFair price that leans toward the heavier side of the book.
KILLSThin books where one order flips it.
BOTYour own order moves price. Bigger orders cost more per unit.
KILLSBacktests that fill any size at the last price.
BOTThe benchmark for how well you got filled.
KILLSChasing VWAP while price trends away.
BOTLog it on every trade. It's where live and backtest split.
KILLSNot logging it, so you never see the leak.
BOTLimit orders pay less, market orders pay more.
KILLSLimit orders that never fill on the best moves.
BOTThe deepest fall from a high. The number that ends accounts.
KILLSJudging it from one backtest path.
BOTLosses cost more than they look.
KILLSSizing up to win it back.
BOTLoss you exceed on 1 day in 20.
KILLSFat tails: real crashes are far past 1.645σ.
BOTRisk of everything together, correlations included.
KILLSUsing calm-period correlations.
BOTChance to lose N units before you stop, for even-money bets.
KILLSBetting 1/5 of the account: N = 5, ruin 37%.
BOTHard rule in code. No human override at 3am.
KILLSA kill switch you can turn off when tilted.
BOTReturn per unit of pain, annualized.
KILLSBacktest Sharpe above 3 usually means a bug.
BOTIs the Sharpe real or luck.
KILLSSix months of data and a victory lap.
BOTTest enough ideas and some pass by luck.
KILLSNot counting the ideas you threw away.
BOTWhat the best random strategy looks like.
KILLSCalling the winner of a grid search an edge.
BOTThe bot is judged only on data it never saw.
KILLSTuning again after looking at the test set.
BOTYour backtest is one path out of millions. Size for the bad ones.
KILLSShuffling destroys streaks that are real.
No formula matches that.